
Interior BC Mobile Home Park Market Report
Cap Rates, Sales Data & Investment Trends (2021–2025)
Introduction
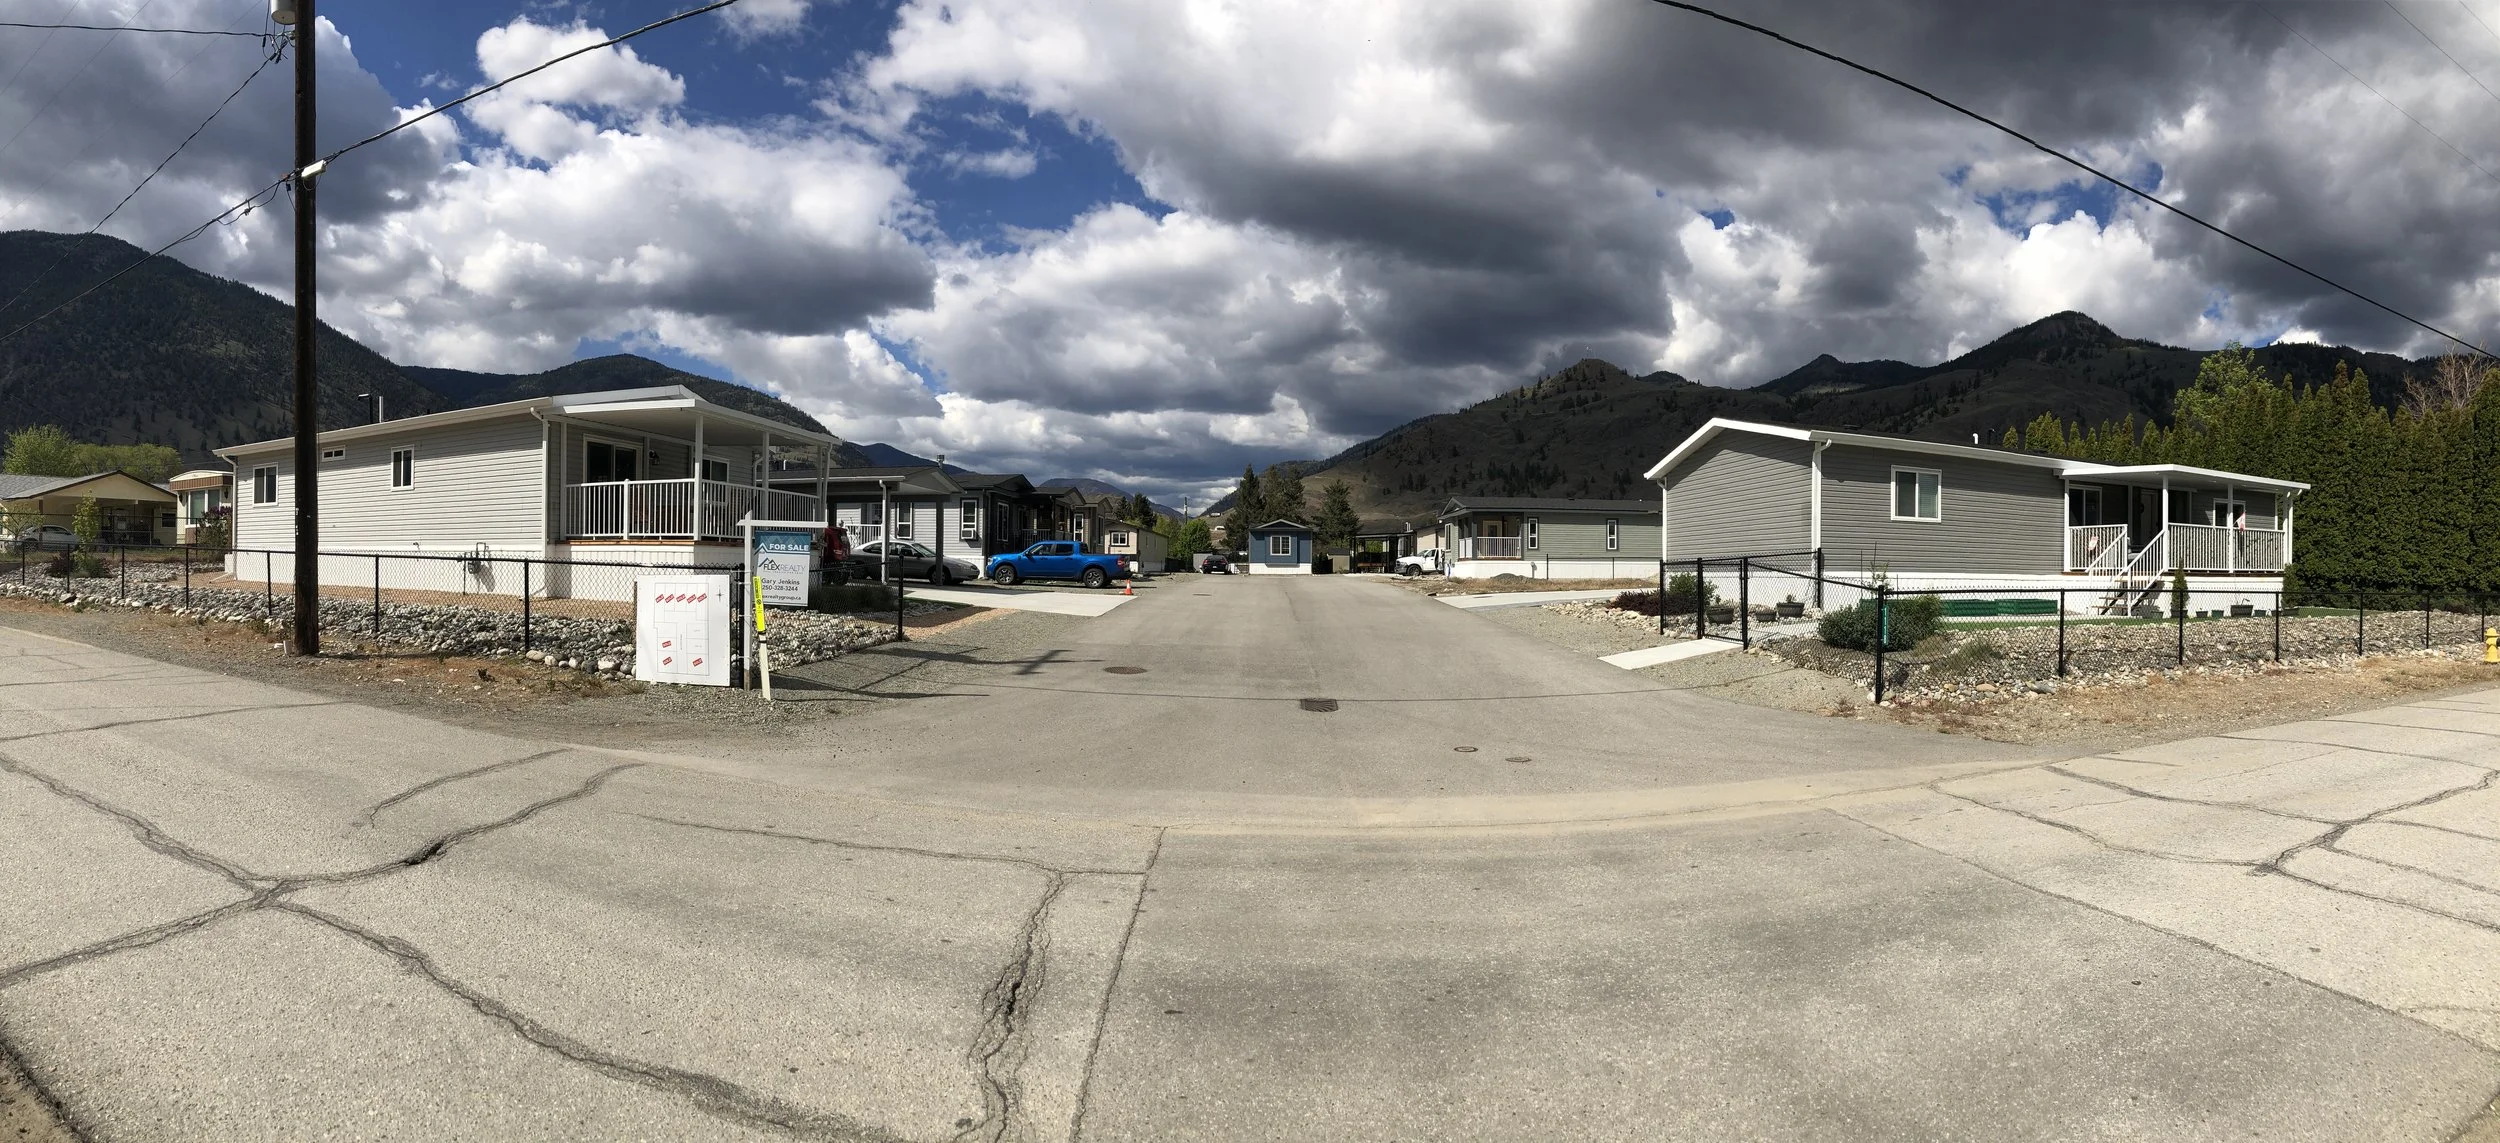
The Interior British Columbia mobile home park market has quietly become one of the more compelling investment sectors in the province. With an aging housing stock, chronic undersupply of affordable rentals, and growing recognition among institutional and private buyers alike, manufactured home communities throughout the Okanagan, Similkameen, Shuswap, and Kamloops regions are attracting serious attention.
This report draws on eleven income-based (cap rate) comparables and twelve sales comparables spanning transactions from 2021 through late 2025, including one active listing. The data covers parks ranging from a modest 7-pad property in Salmon Arm to a 94-pad community in Penticton, providing a meaningful cross-section of what the market looks like today.
Whether you currently own a mobile home park in the Interior and are thinking about what your asset is worth, or you are actively looking to acquire one, the following analysis is intended to give you a grounded, evidence-based view of where pricing and yields are trending.
Cap Rate Analysis: Interior BC Mobile Home Parks
Capitalization rates, or cap rates, are the most widely used metric for valuing income-producing real estate. The cap rate is calculated by dividing a property’s net operating income (NOI) by its sale price. A lower cap rate indicates that buyers paid more for each dollar of income — generally reflecting stronger confidence in the asset, its location, or its long-term income stability. A higher cap rate suggests that buyers required a larger income return relative to the price paid, which typically reflects higher perceived risk, smaller park size, inferior location, or greater management intensity.
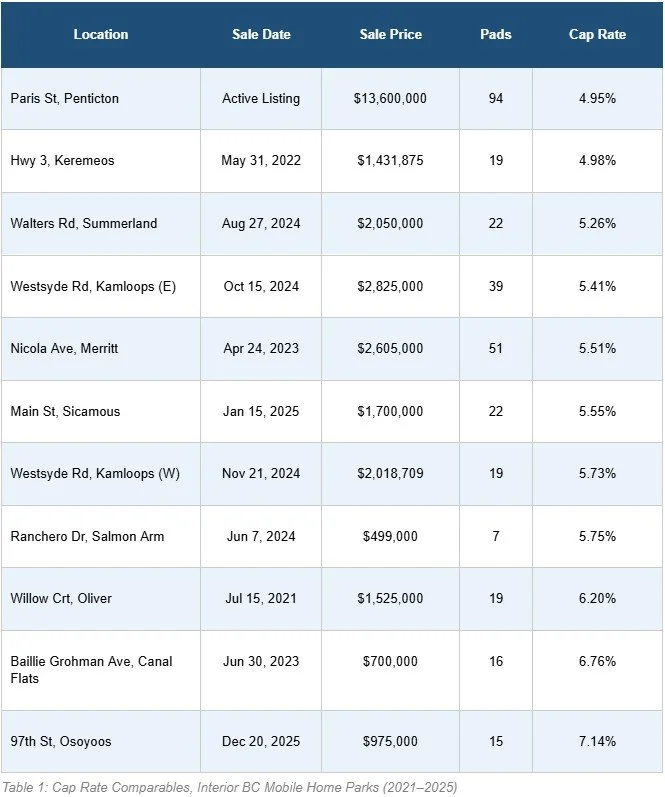
The eleven cap rate comparables in this analysis span a range of 4.95% to 7.14%, reflecting meaningful variation across park size, location, and condition. Below they are presented from the lowest cap rate (highest relative value) to the highest.
Key Observations on Cap Rates
The Lower End: 4.95% – 5.41%
The Paris Street property in Penticton represents the lowest cap rate in the dataset at 4.95%, which is consistent with its status as the largest park in the comparables at 94 pads. Size, city services, and the development optionality this site offers (the City of Penticton supports 4+ storey residential redevelopment) justify buyer willingness to accept a tighter yield. It is worth noting this property has been on the market since February 2024, with its asking price already reduced from $14,900,000 to $13,600,000 after 297 days on market. A recently renewed listing suggests the seller and market are still working toward alignment.
The Keremeos park (4.98%) sold in May 2022, during a period of considerable investor appetite for income properties. The Summerland and Kamloops (East Westsyde) properties, at 5.26% and 5.41% respectively, reflect more current 2024 market conditions and suggest that well-maintained, city-serviced parks with stable tenancies continue to trade at the tighter end of the range.
The Middle Band: 5.51% – 5.75%
The majority of comparables cluster in a 5.51% to 5.75% band. Merritt (5.51%), Sicamous (5.55%), West Kamloops (5.73%), and Salmon Arm (5.75%) all fall here. These parks share several characteristics: they are connected to municipal services, have relatively stable tenant populations, and were marketed with below-market rents — a feature that buyers increasingly view as upside potential rather than a liability, given that rent increases through attrition and new tenancy are a permitted path to income growth.
This middle band appears to represent what a well-run, mid-sized park in a secondary Interior community trades at in normal market conditions. For current owners, achieving an NOI that prices to this range is a reasonable baseline expectation when going to market.
The Higher End: 6.20% – 7.14%
Oliver (6.20%), Canal Flats (6.76%), and Osoyoos (7.14%) reflect sales where buyers required a higher income return relative to the price paid. The Oliver sale occurred in July 2021 and may partially reflect earlier market uncertainty. Canal Flats is a smaller, more rural community with limited buyer depth, which typically pushes cap rates upward. The Osoyoos transaction — the most recent in the dataset at December 2025 — involved a smaller park with a residential home and workshop on-site, factors that introduce some complexity into the valuation and can contribute to a higher yield expectation from buyers. The property also carried an Official Community Plan designation supporting medium-density residential development, which introduces some land use ambiguity that the market appears to have priced accordingly.
Factors That Influence Cap Rates in Mobile Home Parks
Understanding what drives cap rate variation is critical for both buyers underwriting a purchase and owners preparing to sell. Based on this dataset and broader market experience, the following factors are the most significant:
Park Size and Economies of Scale. Larger parks benefit from spread-fixed costs, professional management justification, and deeper buyer pools (including institutional investors). The data consistently shows that larger parks trade at lower cap rates. The 94-pad Penticton park at 4.95% and the 49-pad Merritt park at 5.51% both illustrate this trend.
Municipal Services. Properties on city water and sewer carry meaningfully lower risk than those on well and septic systems. Infrastructure failure on private systems is a material liability. Buyers consistently require higher yields on parks with private water and sewer systems, all else being equal.
Location and Market Depth. Parks in Kelowna, Kamloops, and Penticton benefit from larger, more liquid buyer pools and stronger underlying rental demand. Smaller or more remote communities — Canal Flats, Sicamous, Keremeos — trade with a location premium reflected in higher cap rates.
Rent Levels and Upside. Several parks in this dataset had rents documented as being well below market. While this represents income upside, sophisticated buyers discount for the time value of money and the friction involved in raising rents. Sellers should not assume full-market-rent value is immediately achievable and priced accordingly.
Park Condition and Management Quality. Well-maintained parks with long-term tenancies, updated infrastructure, and low management intensity trade tighter. Deferred maintenance, high vacancy, or tenant conflict all push cap rates wider.
Tenant Ownership vs. Park-Owned Homes. Parks where tenants own their own homes are generally preferred by buyers, as they carry lower management burden and higher tenancy stability. Parks with a mix of park-owned homes introduce revenue but also risk.
Redevelopment Potential. In markets where community plans support intensification, redevelopment value can underpin or exceed income value. This is particularly evident at the Penticton property, where the city’s support for 4+ storey residential redevelopment is a component of the asset’s investment thesis — but also introduces complexity that makes pricing difficult.
Sales Analysis: Price Per Pad
While cap rates tell us about the relationship between income and price, the price-per-pad metric is a complementary indicator of market value that can be applied even when income data is incomplete. It also helps identify outliers — properties where land value, development potential, or site characteristics are driving the transaction rather than income alone.
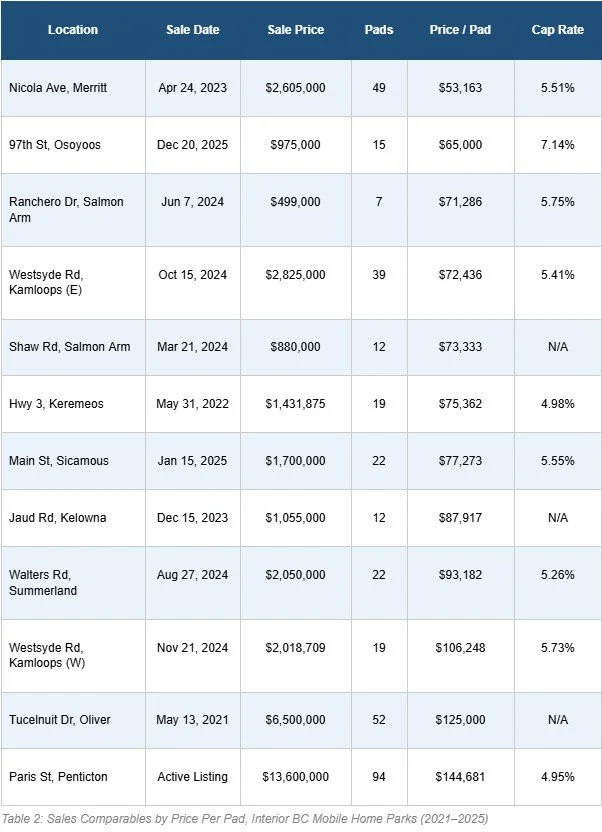
The twelve sales comparables in this dataset — including the active Penticton listing — span a price-per-pad range of $53,163 to $144,681. Below they are presented from the lowest to the highest price per pad.
Notable Sales Commentary
Merritt — Nicola Ave | $53,163/Pad | Apr 2023
The lowest price per pad in the dataset, this 49-pad park on city sewer and water in Merritt sold for $2,605,000 at a 5.51% cap rate. The below-average price per pad for a city-serviced park reflects Merritt’s more limited buyer depth relative to Okanagan communities, and potentially some discount for first-time market exposure. Still, the 5.51% cap rate suggests income performance was solid.
Osoyoos — 97th St | $65,000/Pad | Dec 2025
A 15-pad park that also includes a four-bedroom home and a workshop with in-law suite, this December 2025 sale at $975,000 reflects the additional residential components partially embedded in the price. At a 7.14% cap rate, the income yield was the highest in the dataset, potentially reflecting the complexity of the mixed-use asset, the smaller scale, and the OCP designation that signals potential future land use transition.
Salmon Arm — Ranchero Dr | $71,286/Pad | Jun 2024
A well-maintained 7-pad park on just over an acre, selling in 17 days with a 13% expense ratio. The low price per pad reflects the park’s small scale, which reduces the buyer pool and limits institutional interest. The 5.75% cap rate is reasonable for a compact park with below-market rents and significant upside through attrition.
Kamloops — Westsyde Rd (E) | $72,436/Pad | Oct 2024
A 39-pad park on 4.6 acres with a 1,945 sq ft single-family rental home, selling at $2,825,000. Recent infrastructure upgrades — water system, sewer, underground electrical, and landscaping — make this one of the better-maintained parks in the dataset. At a 5.41% cap rate and $72,436 per pad, it represents good value for a park of this scale and condition in a major Interior city.
Salmon Arm — Shaw Rd | $73,333/Pad | Mar 2024
A 12-pad park on 2.73 acres with a new state-of-the-art septic system and rents that were well below market at the time of sale. No cap rate was available for this property, but the $880,000 price and walking distance to the Shuswap National Golf Course suggest a buyer who saw value in both the income stream and the real estate location. The below-market rents represent meaningful upside for a buyer with patience.
Keremeos — Hwy 3 | $75,362/Pad | May 2022
A 19-pad, age-restricted (55+) park on the Similkameen River, selling at $1,431,875 in a strong 2022 market. The 4.98% cap rate was achievable in a lower-rate environment. This sale now serves as a useful historical anchor for understanding how market conditions have shifted since.
Sicamous — Main St | $77,273/Pad | Jan 2025
Eldorado Mobile Home Park, a 22-pad seniors park on 2.64 acres, sold at asking price in January 2025. Connected to city services, recently upgraded with new fencing and light standards, and carrying MHP1 zoning. At 5.55%, the cap rate is consistent with a well-run seniors park in a smaller Interior community. The clean sale at asking price suggests the property was well-positioned.
Kelowna — Jaud Rd | $87,917/Pad | Dec 2023
A 12-pad park on 6.39 acres in South East Kelowna, with the distinction of being zoned MH-1 and outside the Agricultural Land Reserve. Only half the 6.39-acre site is used for the mobile home park — the balance is raw vacant land. No income data was available, but the $87,917 per pad likely significantly underestimates the per-acre land value being acquired here. This is as much a land play as a mobile home park acquisition, and the Kelowna market’s trajectory supports that thesis.
Summerland — Walters Rd | $93,182/Pad | Aug 2024
A 22-pad park on 8.58 acres selling in 12 days at $2,050,000 with a 5.26% cap rate. Well below market rents at time of sale provide an income growth runway. The large site relative to pad count (8.58 acres for 22 pads) is notable and may reflect land with potential that the market has not yet fully priced.
Kamloops — Westsyde Rd (W) | $106,248/Pad | Nov 2024
A 19-pad park across 2.27 acres that also includes two legal rental houses, selling at $2,018,709 at a 5.73% cap rate. The inclusion of two legal houses adds to both income and complexity. The $106,248 per pad is among the higher results in the dataset and reflects the combined value of the mobile home park and ancillary residential income.
Oliver — Tucelnuit Dr | $125,000/Pad | May 2021
A 52-pad manufactured home park on 7.29 acres on the edge of Tuc-El-Nuit Lake, selling at $6,500,000 in May 2021. No income cap rate data was available for this comparable, but at $125,000 per pad, the pricing reflects both the park’s scale and its exceptional waterfront-adjacent location in the South Okanagan wine country corridor. This is a premium asset in a premium location.
Penticton — Paris St | $144,681/Pad | Active Listing
The largest park in the dataset at 94 pads, currently listed at $13,600,000 after a price reduction from $14,900,000. At $144,681 per pad — the highest in the dataset by a considerable margin — the pricing is driven by a combination of income (4.95% cap rate on $673,223 NOI), scale, city services, and significant redevelopment optionality. The City of Penticton’s support for 4+ storey residential development on this site gives the asset a density premium. The 297 days on market at the previous price reflects the challenges of pricing for a dual-narrative asset — income investors and developers evaluate it differently.
Conclusion
The Interior BC mobile home park market is active, data-driven, and increasingly understood by a sophisticated buyer pool. Cap rates in the region have generally settled in a 5.25% to 5.75% range for well-run, city-serviced parks of reasonable scale — with outliers on both ends reflecting exceptional assets or elevated risk profiles. Price per pad ranges widely from the low $50,000s to over $140,000, with location, size, services, and land value all playing meaningful roles.
For owners, the data suggests that parks with current management, city services, long-term tenancies, and documented income will find a receptive market. Below-market rents, while often described as upside, should be presented carefully — buyers discount for the time and friction involved in realizing that potential.
For buyers, the dataset highlights that the most competitive assets continue to sell quickly — in some cases in under two weeks — while more complex properties (mixed-use, redevelopment plays, larger assets with pricing ambiguity) can sit. Disciplined underwriting, a clear view on income versus land value, and local knowledge of municipal zoning and infrastructure remain the core competencies needed to transact successfully in this market.
RDOS Appraisal & Consulting monitors mobile home park transactions throughout the South Okanagan, Similkameen, Thompson-Nicola, and Shuswap regions on an ongoing basis. If you are considering selling a park, acquiring one, or simply want a current assessment of what your asset might be worth, we would welcome the conversation.
Disclaimer: This article is prepared for informational purposes only and does not constitute appraisal advice or a formal valuation opinion. All data is sourced from publicly available market transactions and internal research compiled by RDOS Appraisals & Consulting. Readers should seek independent professional advice before making investment decisions.
© 2025 RDOS Appraisals & Consulting | rdoscommercial.com | Interior BC Commercial Real Estate
Get Your Professional Mobile Home Park Appraisal Today
RDOS Appraisals & Consulting delivers comprehensive mobile home park property valuations backed by extensive local market knowledge, detailed comparable sales analysis, and professional credentials recognized by lenders, courts, and commercial real estate professionals throughout British Columbia.
Contact us today for expert mobile home park real estate appraisal services in Penticton and the South Okanagan:
RDOS Appraisals & Consulting
T: 250.490.5266
E: bryce@rdoscommercial.com
www.rdoscommercial.com
Serving Penticton, Summerland, Oliver, Osoyoos, Okanagan Falls, Princeton, Keremeos and Naramata with professional commercial real estate appraisal services. Specializing in Retail, Office, Industrial, Multi-Family, Hospitality and Commercial Land.